This Chart Shows Why Inflation Isn't Going Anywhere
I want to show you something important today.
If I do my job, it will greatly affect the way you trade and think about the markets.
It has to do with everything that's in the financial news. And yet I don't think I've seen anybody looking at things quite this way. Hopefully you tuned in to this week's live video call. I went in-depth on the idea.
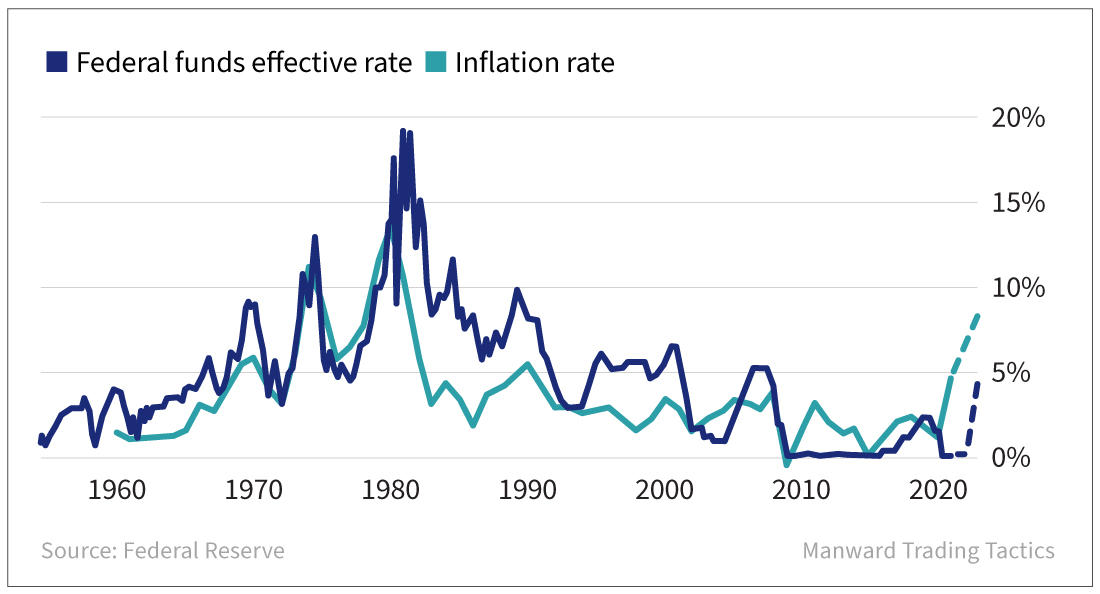
Look at the chart below. It shows two simple things. The Fed's benchmark rate (the one you hear so much about in the news) is in dark blue. The annual inflation rate is in teal.
The chart tells us a lot...

First, it tells us that the Fed's rate is nowhere near "high" - at least not compared with historical levels.
But here's the thing: That teal line is cut short (the dashed section is a projection). Inflation is an annual figure, so the chart doesn't include the most recent numbers. Almost certainly, the rate for this year will be north of 7%... and likely closer to 8%.
When we hit that level of inflation in the '70s, the Fed funds rate was in double digits... more than twice as high as it is today.
In fact, looking back at the last 70 years, it has been very rare to see the rate of inflation above the Fed's key rate. But, in a worrisome sign, that's the case today. The inflation rate is currently double the Fed's short-term rate.
It tells us that either the folks in charge still believe in the "transitory" nature of this round of inflation... or rates have a lot more room to climb.
For traders, that last idea is scary.
As I mentioned on Wednesday's call, this chart is not good news for the traders who sent stocks soaring last week after the latest inflation numbers came in just shy of expectations. It tells us that they're expecting the Fed to back down too quickly.
They could get burned... and burned badly.
To see why, we just need to look a bit closer at the chart. No period of hefty inflation has seen rates go straight up and then straight down.
It just doesn't work that way.
In the '70s, inflation surged, backed down a bit... surged higher... and then went higher still.
Each time it moved, folks thought surely they'd seen the peak. And yet, even on its way down, we saw quick spikes in the inflation rate.
As traders, this knowledge is quite valuable. It helps us keep the narrative straight and avoid the sort of emotional trading the headlines tend to stir.
Inflation isn't going away overnight. This is a long-term battle.
Invest accordingly.
Be well,
Andy Snyder
Reprinted with permission from Manward Press


